Three ways to predict adult height
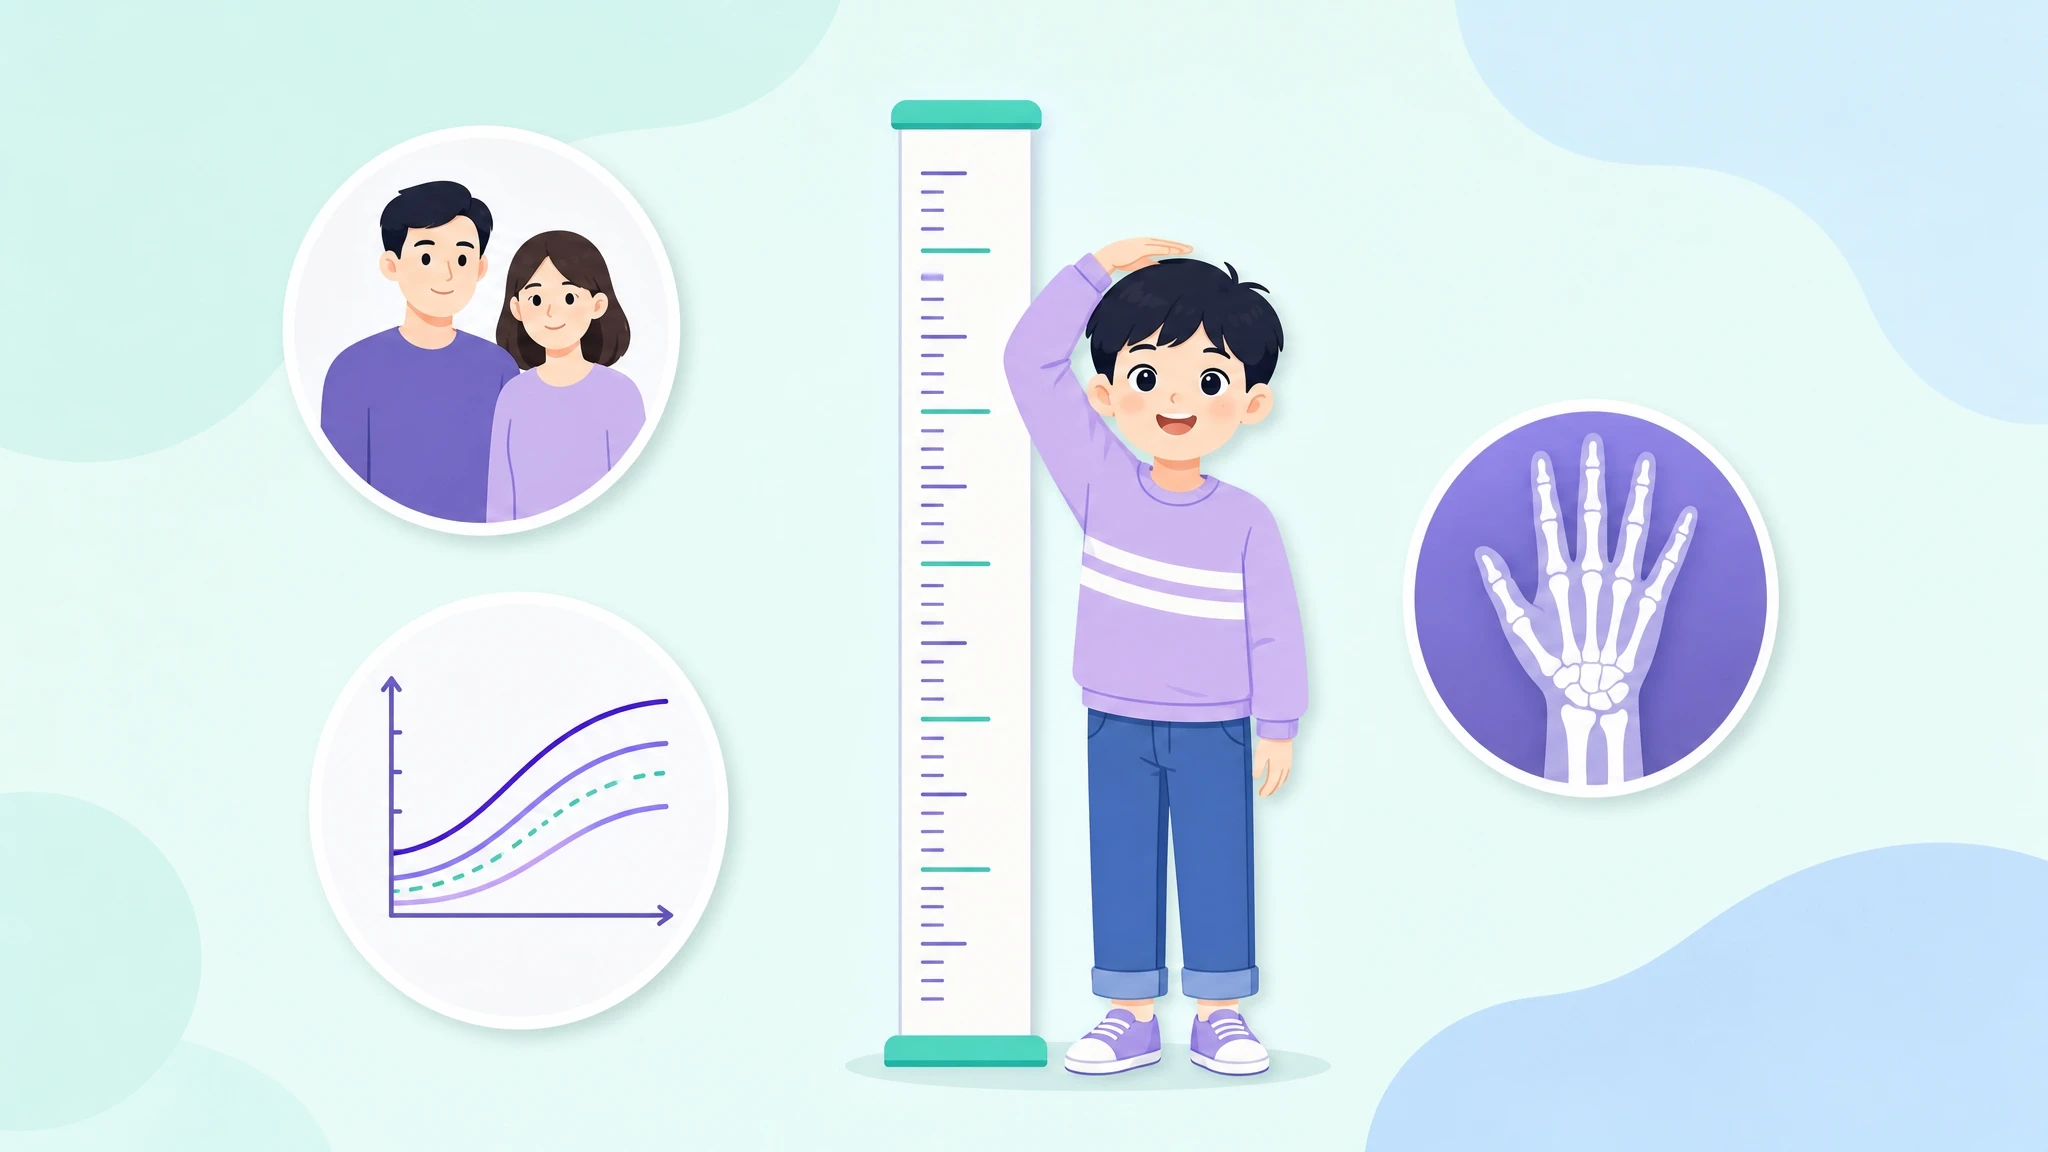
There are three main ways to predict how tall your child will be as an adult: using the parents' heights, using a national growth chart (percentile), and using a hand X-ray to read bone age (the growth plates). Below we explain how each is actually calculated and how accurate it is. In short, the parental formula and growth charts are useful for a home estimate, but the most accurate prediction comes from a bone-age X-ray. You can try our free height calculator, which uses the growth-chart method.
Method 1 — Mid-parental height formula

This estimates a child's genetic target height from the parents' heights:
- Boys = (father's height + mother's height + 13) ÷ 2 (cm)
- Girls = (father's height + mother's height − 13) ÷ 2 (cm)
The ±13 cm adjusts for the average height difference between adult men and women. For example, a boy with a 175 cm father and 162 cm mother has a target height of (175 + 162 + 13) ÷ 2 = 175 cm. This is the midpoint; the child's genetic range is roughly ±8–9 cm around it (about 166–184 cm here).
Limitation: the standard mid-parental formula explains only about 36% of the variation in children's heights (Zeevi et al., 2024). It is a genetic baseline and says nothing about how the child is actually growing now.
Method 2 — National growth chart (percentile)
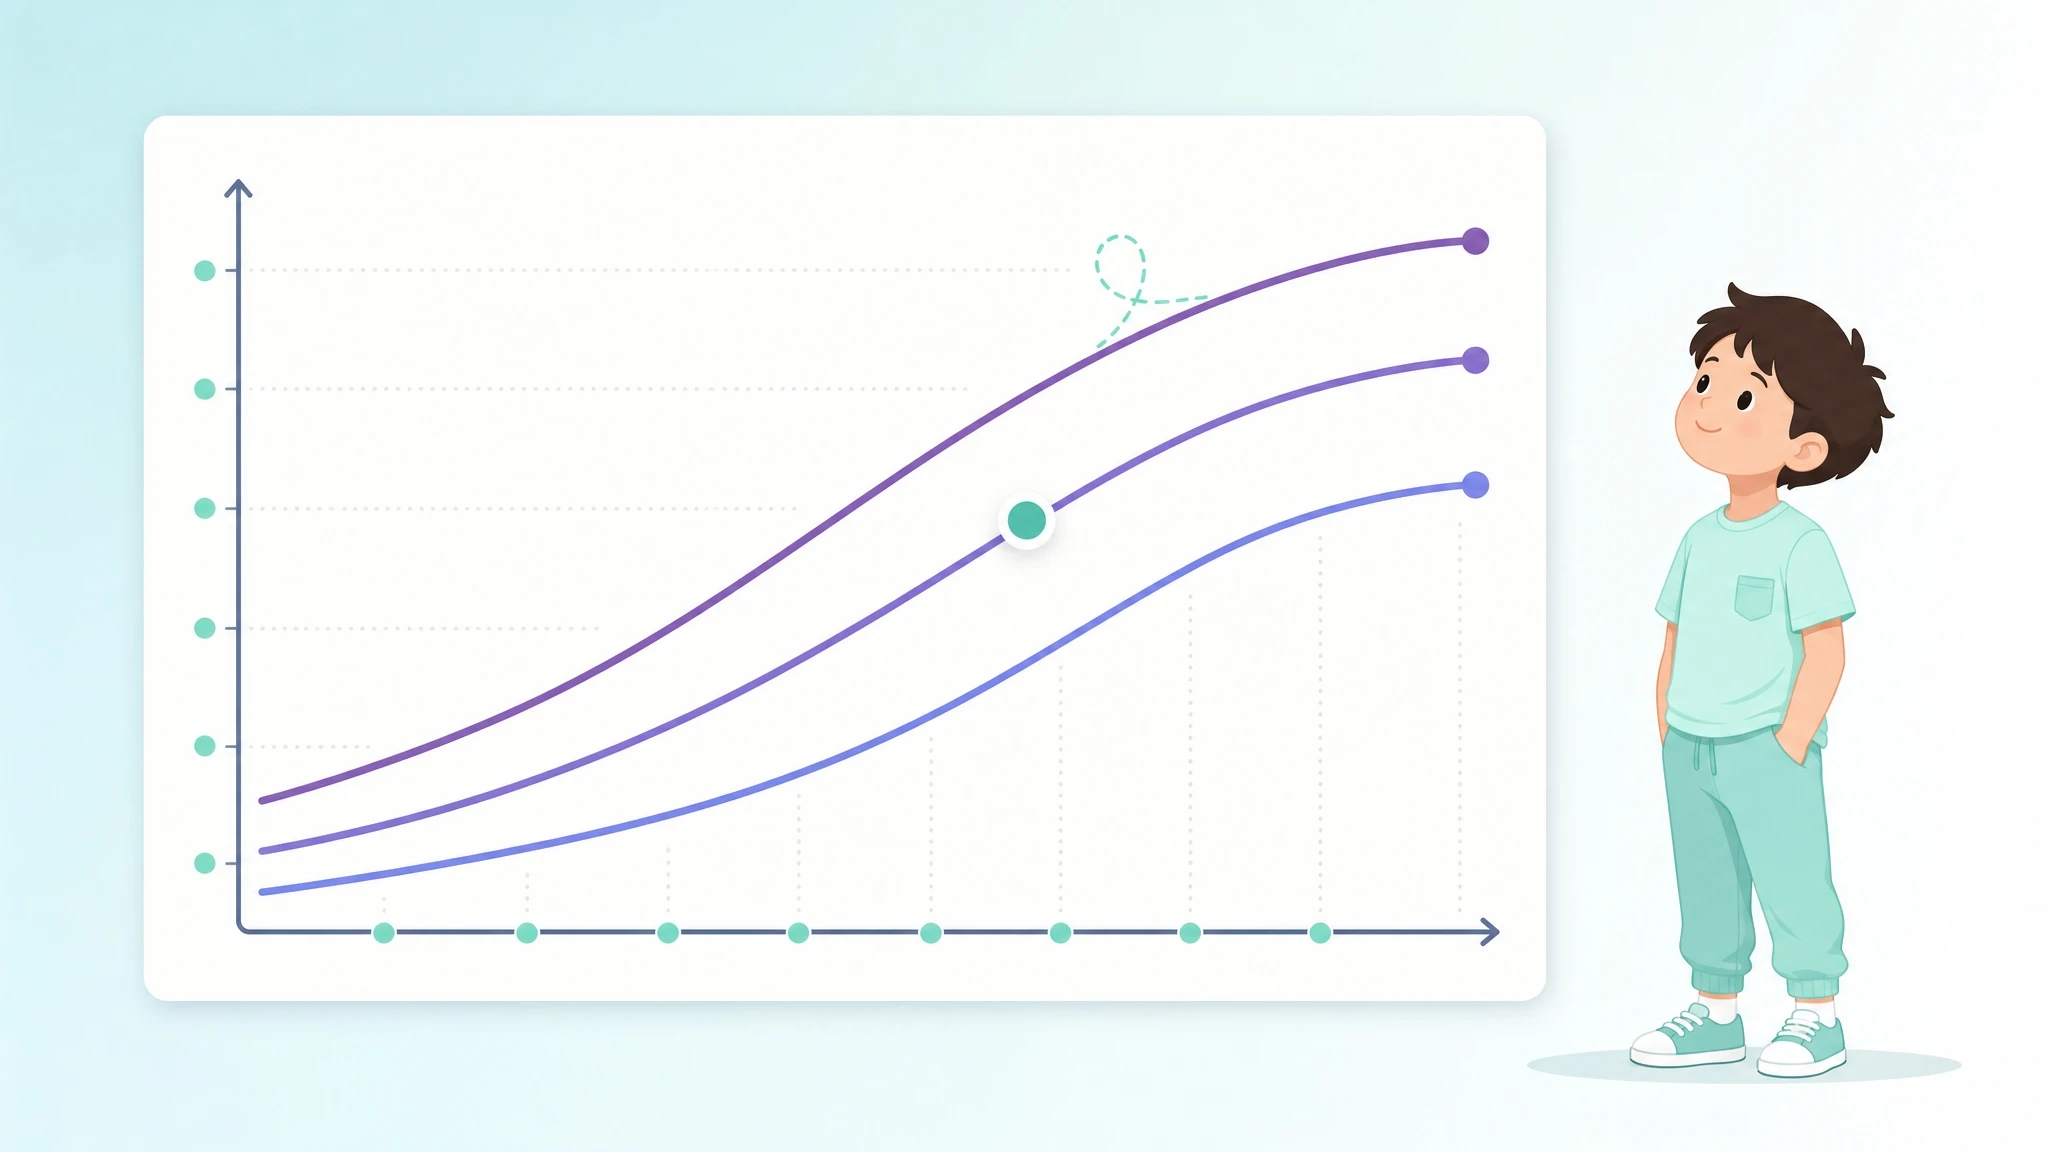
Here the child's current height is placed on a national growth chart for their age and sex to find a percentile, and that percentile is projected to adulthood. The steps are:
- Step 1 — read the child's current percentile (e.g., 30th percentile).
- Step 2 — more precisely, compute a Z-score from the chart's L, M, S values: Z = ((height ÷ M)L − 1) ÷ (L × S), where M is the median height, S the coefficient of variation, and L a skew factor.
- Step 3 — assume the child stays near that percentile and read off the corresponding adult height.
Our free calculator uses this method. ★ You must use the growth chart that matches the child's ethnicity/nationality. Average height and growth curves differ by country, so the same height gives a different percentile — and a different predicted adult height — depending on which chart you use.
- Example (Southeast Asia): Indonesian adult men average about 12 cm shorter than Western/WHO references. Placing a typical Indonesian child on a US (CDC) or WHO chart makes an average child look like a low-percentile "short stature" case and under-predicts adult height. The Indonesian standard gives the correct percentile.
- Example (East Asia): conversely, using a Western chart for Korean or Chinese children also distorts the percentile, because growth pace and puberty timing differ by ethnicity.
That is why our calculator lets you select nationality (Korea/KDCA, US-Australia/CDC, China, Thailand, Indonesia). Limitation: even with the right chart, the "stays on the same percentile" assumption breaks down when puberty is early or bone age is advanced.
Method 3 — Bone-age X-ray (the most accurate)
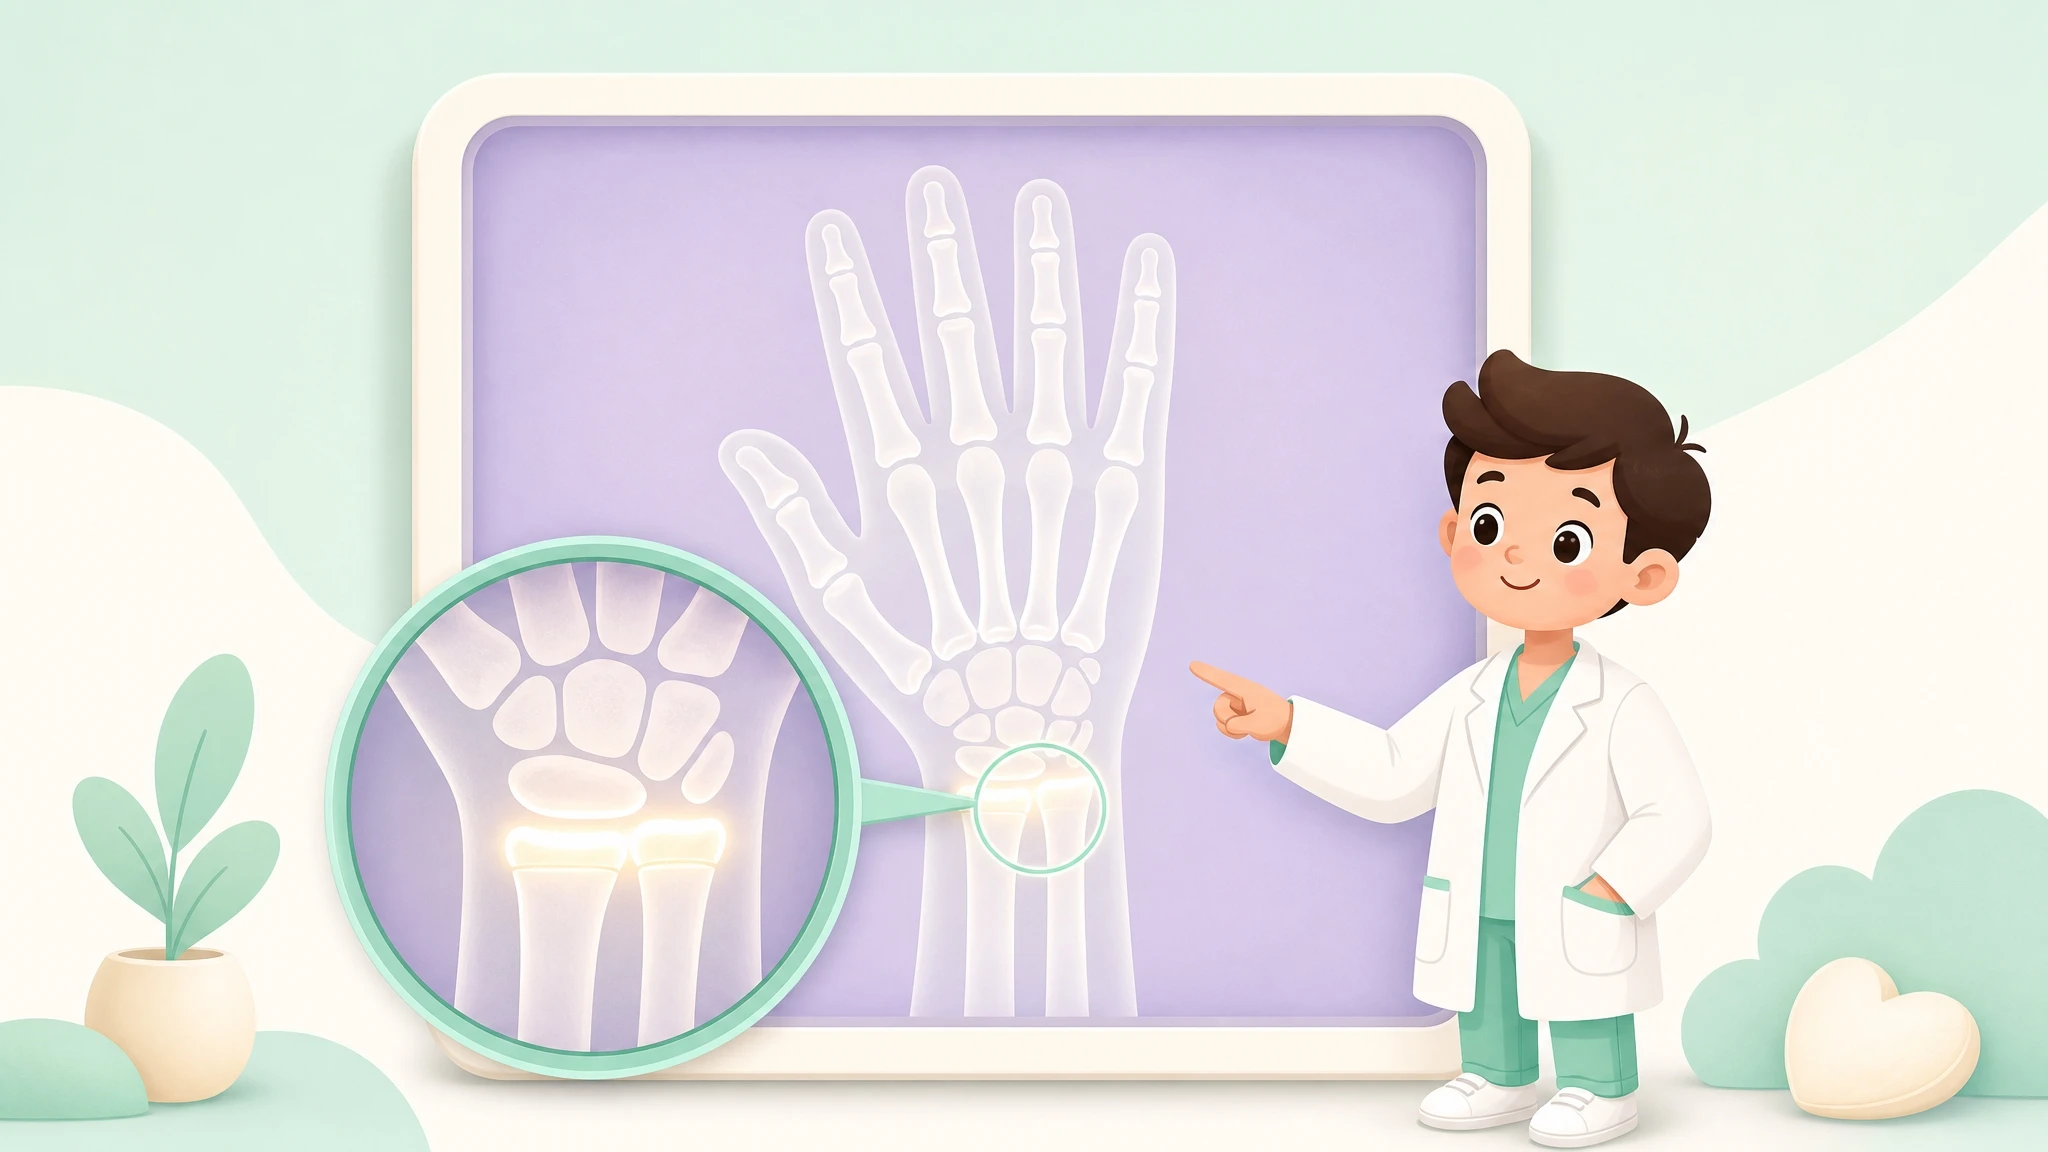
A hand X-ray shows how much growth plate remains. Bone age reflects a child's true physiological maturity better than chronological age (Spadoni & Cianfarani, 2010). Practically, tables such as the Bayley-Pinneau method give the percentage of adult height already reached at a given bone age, so adult height = current height ÷ that fraction; TW3 and BoneXpert are more refined methods.
The hand/wrist is standard, but whether the growth plates are still open is also checked with X-rays of other sites. To judge remaining growth more accurately, clinicians also look at the knee, pelvis, and foot:
- Knee (distal femur, proximal tibia) — a major contributor to height; a knee X-ray shows whether these plates are open (growth remaining) or closed (Fabricant et al., 2021).
- Multiple sites combined — adding hip, knee, and foot maturity to the hand X-ray predicts remaining growth more accurately (Yu et al., 2021, Yale).
- Pelvis (Risser sign) — ossification of the iliac crest (the Risser sign) shows how much spinal (sitting-height) growth is left (Wang et al., 2009).
This is why we assess not only the hand bone age but, when needed, other sites to see the true state of the growth plates. On accuracy, bone-age prediction is the most reliable:
- Bone-age-based prediction was within ±5 cm of actual adult height in 92.9% of cases (Huang et al., 2022).
- Automated bone-age prediction has an error (RMSE) of about 2.7–3.3 cm (Thodberg et al., 2009).
- A Yonsei University study in Korean children found a mean error of 4.62 cm (Suh et al., 2023).
When you need a clinical assessment

The parental and growth-chart methods are home screening tools. Accurate prediction and a real judgment of remaining growth need a bone-age X-ray. If your child's predicted height is low, if they are slipping down the growth chart, or if puberty seems early, a clinical assessment with bone age and blood tests is the reliable next step. This article is general information; diagnosis is confirmed only through an in-person examination.
FAQ
How accurate is a child height prediction?
The parental formula explains only about 36% of height variation, and growth-chart predictions weaken if growth is not steady. Bone-age X-ray is the most accurate, within ±5 cm in most cases.
Are the parental and growth-chart methods enough?
They are useful for a home estimate, but they cannot show how much growth is actually left. Only a bone-age X-ray does that.
Is bone age only measured from the hand?
The hand/wrist is the standard, but the knee, pelvis (Risser sign), and foot are also X-rayed to confirm whether the growth plates are still open.
References
- Accurate Prediction of Children's Target Height from Their Mid-Parental Height Children (Basel). 2024. PubMed · DOI
- Bone Age Estimation and Prediction of Final Adult Height Using Deep Learning Yonsei Med J. 2023. PubMed · DOI
- Prediction of adult height based on automated determination of bone age J Clin Endocrinol Metab. 2009. PubMed · DOI
- Combined assisted bone age assessment and adult height prediction methods in Chinese girls with early puberty Pediatr Radiol. 2022. PubMed · DOI
- Bone age assessment in the workup of children with endocrine disorders Horm Res Paediatr. 2010. PubMed · DOI
- Combining Lower Extremity Radiographic Markers Begets More Accurate Predictions of Remaining Skeletal Growth J Pediatr Orthop. 2021. PubMed · DOI
- Reliability of Radiologic Assessments of Clinically Relevant Growth Remaining in Knee MRI of Children and Adolescents Orthop J Sports Med. 2021. PubMed · DOI
- Correlation of Risser sign, radiographs of hand and wrist with the histological grade of iliac crest apophysis Spine. 2009. PubMed · DOI